mbctaPlots_#####.root.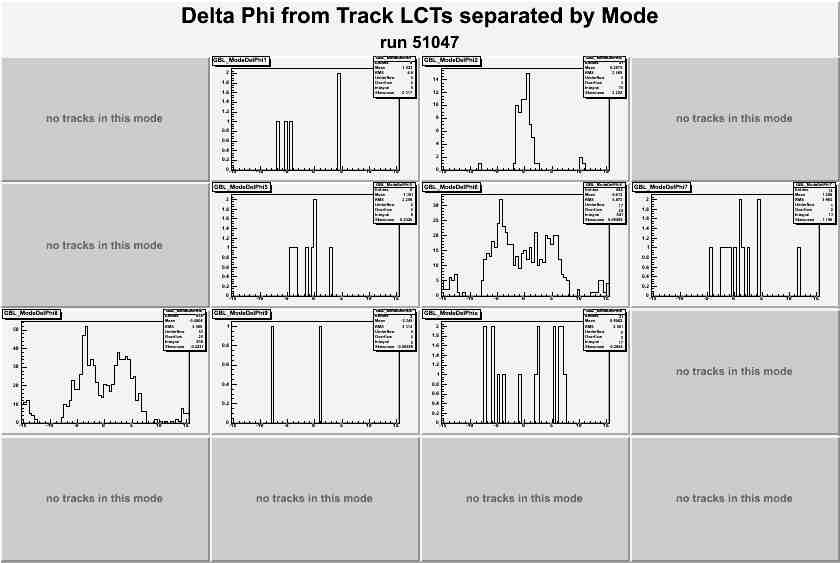
MBCTA_DPhi_#####, but with η instead of φ.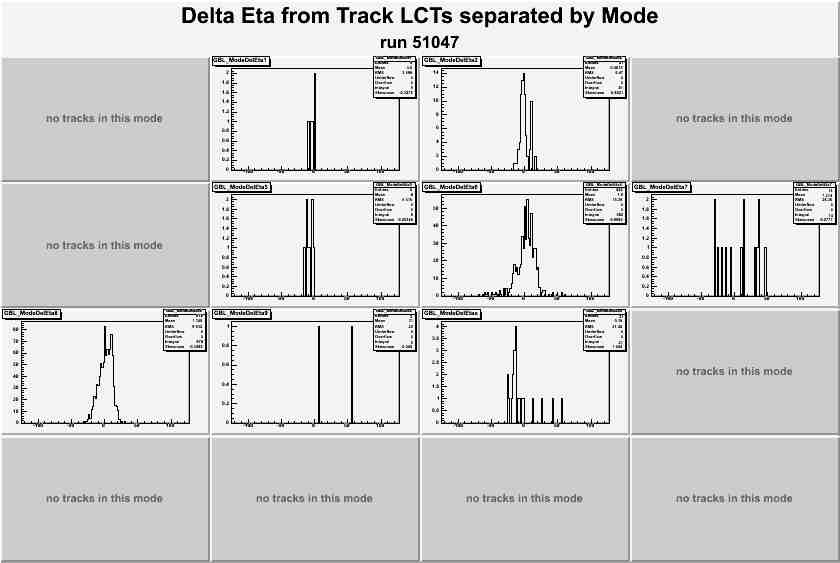
Zipped files for CSCTF MBC Track Analysis Pack
The CSCTF Mode and Basic Cut Track Analysis Package (CSCTF MBCTAP) is an analysis package designed to check the contents of tracks made by the CSC Track Finder as found in CSC data. In particular, it compares the assigned track modes with their contents and examines cuts Δη and Δφ. The package automatically outputs a few basic statistics for these analyses. The package also comes with a root script, showMBCTPlots, that displays the histograms of the data.
CSCTF MBCTAP was written during summer 2008 by Summer Student Kristin Beck using CMSSW_2_0_7.
*.zip fileThe CSCTF MBCTAP is provided here as a *.zip file: [Zipped files for CSCTF MBC Track Analysis Pack]. This zipped package contains the following files:
CSCTFAnalyzer.ccCSCTFAnalyzer.hanalyzer_dch.cfgMBCTAnalyzer.CMBCTAnalyzer.hcompile.shrunAnalysis.cppshowMBCTPlotscsctf-mcbcap.zip, you must move the files into the appropriate directories prior to compiling as follows (recipe for moving is in section 3: Code Recipes):
.../EventFilter/CSCTFRawToDigi/plugins/:
CSCTFAnalyzer.cc.../EventFilter/CSCTFRawToDigi/interface/:
CSCTFAnalyzer.h.../EventFilter/CSCTFRawToDigi/test/ (or the directory folder within the CSCTFRawToDigi directory where you will be running over your test files. Please note that within this document, this directory will be referred to as test) :
analyzer_dch.cfgMBCTAnalyzer.CMBCTAnalyzer.hcompile.shrunAnalysis.cppshowMBCTPlotsTo compile the code, first make sure you have the appropriate files (see section 2a: Instalation from the *.zip file) and have set up your operating environment within CMSSW. This may be done by running the command eval `scramv1 runtime -csh` in the directory .../EventFilter/CSCTFRawToDigi/. Then, follow the following steps to compile:
CSCTFAnalyzer.cc and related files by running the command scramv1 b -r from within the directory .../EventFilter/CSCTFRawToDigi/.MBCTAnalyzer.C by running the command ./compile.sh within the directory .../EventFilter/CSCTFRawToDigi/test/To run the code, you will first need to choose the files to run over. You can either run over a *.root file saved locally or use one stored on CASTOR. As of the writing of this document, the easiest way to obtain the proper path for data file(s) is to use the DBS data discovery page. These path(s) need to be put into the file analyzer_dch.cfg, which should be in the .../EventFilter/CSCTFRawToDigi/test/ directory. They should be inserted on line 12 within the brackets following untracked vstring fileNames = { as follows:
'file:/absolute file path/file.root''/store/path/file.root' (this entire line is the path copied from DBS) '/path to file 1/file1.root',
'/path to file 2/file2.root',
'/path to file 3/file3.root'Now that you have edited analyzer_dch.cfg, it's time to run the code.
.../EventFilter/CSCTFRawToDigi/test/ run the command cmsRun analyzer_dch.cfg. cmsRun analyzer_dch.cfg > ! myOutFile.txt.&).mbctaCodeError.txt and mbcta.root. For information on the output files, see section 2c: Understanding the Output. mbcta.root, mbcta0.root, mbcta1.root, mbcta2.root, mbcta3.root, etc.). Multiple files are not yet supported in the *.C second stage analysis. ./runAnalysis.exembctaTextOut_#####.txt and mbctaPlots_#####.root where ##### is the run number for the input data.showMBCTPlots by running the command root showMBCTPlots -l. You will be prompted for 3 numbers, which you should enter separated by spaces followed by a carridge return:
0 displays mode error graphs, 1 displays Δη and Δφ graphs, 42 displays both),1 is yes, 0 is no)mbctaPlots_#####.root.0 0 51047 after the prompt.If you run the complete code, there will be several output files and command line outputs. These outputs include (1) information about the program's operation, including error messages pertaining to the program itself, (2) slimmed down data (*.root) files, (3) information about the data processed, including statistics, (4) *.root histograms and (5) graphs.
Of these, the files you will use for checking data are mbctaTextOut_#####.txt, which is output from the second stage of analysis (./runAnalysis.exe), and the graphics files that come out of the final root script (root showMBCTPlots -l).
mbctaTextOut_#####.txt is divided into 3 sections.
ERROR: Mode 6 track with LCTs 1-3- filled.  Global LCTs : 1-3- Expected from Mode : 12--  **** expected is not in the track ****
Track # 0 in Event # 3742778 in Run # 51047**** expected is not in the track ****, for example:ERROR: Mode 15 track with LCTs ---- filled. Global LCTs : 123- Expected from Mode : -23-
Track # 1 in Event # 3706572 in Run # 51047ERROR: Delta Eta out of bounds. I have Delta Eta = 7 which is out of our allowed range for mode 8 of [-5, 5].
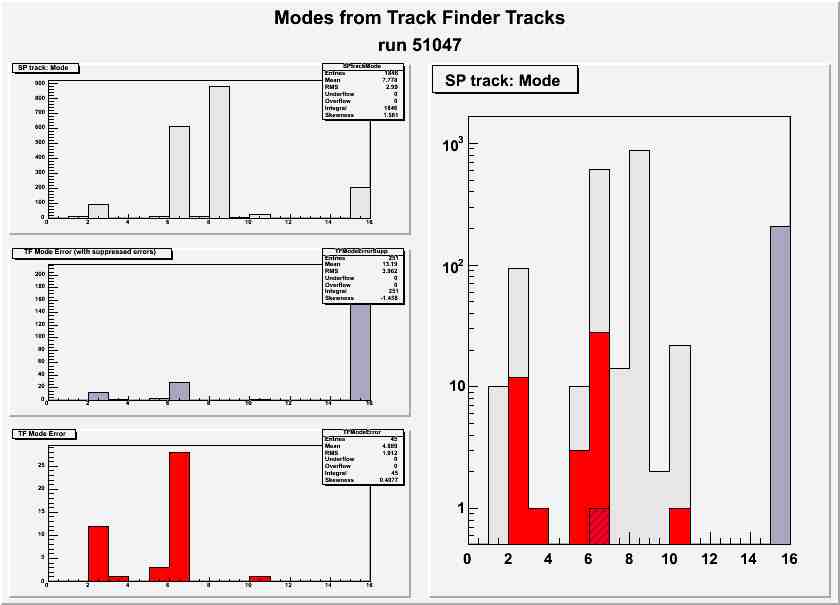
Track # 0 in Event # 14579 in Run # 46794 with Global LCTs : -23-CSCTFAnalyzer.cc and not an error with the data.There are three graphs that showMBCTPlots automatically outputs (all of these graphs are output when you use option 42 for the choice of graphs):
mbctaPlots_#####.root.MBCTA_DPhi_#####, but with η instead of φ.[*.ppt overview of the graphs]
The following is what I type into my command line window to run the code. I assume you already have the unzipped files in a directory named csctf-MBCTAP located in .../EventFilter/CSCTFRawToDigi/ and are operating within the directory .../EventFilter/CSCTFRawToDigi/.
Installation
cp csctf-mbctap/CSCTFAnalyzer.cc plugins/.
cp csctf-mbctap/CSCTFAnalyzer.h interface/.
cp csctf-mbctap/analyzer_dch.cfg test/.
cp csctf-mbctap/MBCTAnalyzer.C test/.
cp csctf-mbctap/MBCTAnalyzer.h test/.
cp csctf-mbctap/compile.sh test/.
cp csctf-mbctap/runAnalysis.cpp test/.
cp csctf-mbctap/showMBCTPlots test/.
Compiling eval `scramv1 runtime -csh`
scramv1 b -r
cd test
cmsRun analyzer_dch.cfg > ! myOutFile.txt &
...when that is done running..../compile.sh
./runAnalysis.exe
Showing and Saving Graphsroot showMBCTPlots -l
42 1 ##### [return] (where ##### is the run number).
This package has been written so that commonly changed parameters are easily accessible before compiling the package. The following options can be set:
mbctaCodeError.txt output from cmsRun. Edit the string myStringForSaving on line 116 of CSCTFAnalyzer.ccmodeErrorSuppressionMask on line 16 of MBCTAnalyzer.C. This mask is defined in binary as (0b)fedcba9876543210 where each character stands for the mode with the corresponding name. A zero masks a mode. For example, 0b0111111110111101 (which is 0x7fbd in hexidecimal) masks modes 1, 6 and 15.
mbctaTextOut_#####.txt. Edit the string supressionNotes on line 25 of MBCTAnalyzer.C.
MBCTAnalyzer.C. Choices are:
0 difference calculated from just the first two nonempty tracks1 difference calculated from any two consecutive tracks2 difference calculated from any combination of tracks0 would return the difference between the values read from stations 4 and 2, 1 would return 4-2, 2-1 and 2 would return 4-2, 4-1 and 2-1.MBCTAnalyzer.C. They are in arrays have the values by mode where we have modes given by {0,1,2,3,4,5,6,7,8,9,a,b,c,d,e,f}.MBCTAnalyzer.C.MBCTAnalyzer.C on the line that currently reads if (!((modeErrorSuppressionMask & (1 >>csctf_mode-track])) == 0) { //mask here. Refined mode definitions should be added in the if-statement that begins 6 lines before this.equalScalingByMode=kTRUE) or scaled automatically to fit the data in the histogram (equalScalingByMode=kFALSE). This option is set on line 6 of showMBCTPlots.showMBCTPlots. The string graphicsType on line 8 of showMBCTPlots determines the file type for output. Options accepted by the command include jpg, eps, ps, pdf, jpg, cxx, xml, png, xpm, svg, tif & root.cout statement that begins with cout<<"Mode key: \nMode || Sections Occupied\n... in showMBCTPlots (line 193-195). This should be changed to reflect any specialized mode placement, for example the assignment of low eta tracks to mode 6 with track content other than tracks 1 and 2.For an overview of the analysis output files, see section 2c: Output Overview.
The complete code outputs several output files and command line outputs. These outputs include (1) information about the program's operation, including error messages pertaining to the program itself, (2) slimmed down data (*.root) files, (3) information about the data processed, including statistics, (4) *.root histograms and (5) graphs. We will go through the outputs file-by-file.
out is the file that runtime data is piped to from the command cmsRun analyzer_dch.cfg > out. This file contains error logs from CMSSW and descriptions of the events that have been unpacked. If you have edited CSCTFAnalyzer.cc to include cout statements for debugging, you will find them in this file.mbctaCodeError.txt is a file that contains error messages related the size of the arrays used to store global LCTs and attempts to overwrite array elements that have already been written (usually due to an indexing error). These messages correspond to either the global LCTs (error message reads ...an LCT with an ID more than..., corresponds to gbl_station_lct) or track LCTs (error message reads ...a track LCT..., gbl_phi_t and gbl_eta_t)mbcta.root is the *.root tree that contains the data we need from the entire data file for analyzing the track content, mode and Δη and Δφ cuts.mbctaTextOut_#####.txt contains error messages from checking track content against track mode and statistics. For a complete description, see section 2c: Output Overview.mbctaPlots_#####.root is the *.root tree that contains histograms produced by analysis. If you want to view, for example, a single histogram from the Δη or Δφ by mode graphs, one way of accessing it would be to open this file using the TBrowser in root.CSCTF_Mode_#####, DEtaByMode_##### and DPhiByMode_##### display the histograms of the data in a compact form that can be used for presentations. For a complete description, see section 2c: Output Overview.MBCTAnalyzer.CMBCTAnalyzer.CCSCTFAnalyzer.cc and CSCTFAnalyzer.hThis code is the basic analyzer that interacts with CMSSW to extract data from the massive *.root data files. This code extracts data from both the global event LCTs and the track LCTs. The areas where this extraction takes place are clearly marked.
If any errors show up in mbctaCodeError.txt that say that an upper limit needs to be updated, this means that the corresponding arrays for variables in either the global LCTs ("...an LCT with an ID more than...", corresponds to gbl_station_lct) or track LCTs ("...a track LCT...", gbl_phi_t and gbl_eta_t)
analyzer_dch.cfgThis is the configuration file for CMSSW's cmsRun. The source path to the original *.root data file for analysis is entered here.
showMBCTPlotsThis root script is responsible for the display of the histograms. It is responsible for the way the histograms are displayed and graphics output.
MBCTAnalyzer.C and MBCTAnalyzer.hThese *.C and *.h files are responsible for the majority of the analysis work that the analysis package does. They build histograms, calculate Δη and Δφ and compare track content to assigned mode.
compile.shInstructions for compiling runAnalysis.cpp and thus how to access the functionality of MBCTAnalyzer.C
runAnalysis.cppInstructions for how to use the codebits from MBCTAnalyzer.C; this is what is actually compiled and run.
Best of luck using this analysis package; if you have any questions, please do not hesitate to contact me [Kristin Beck's email].
Last updated: 15 August, 2008